

Microsoft Defender for Endpoint in the Enterprise: A Practical IT Support Guide
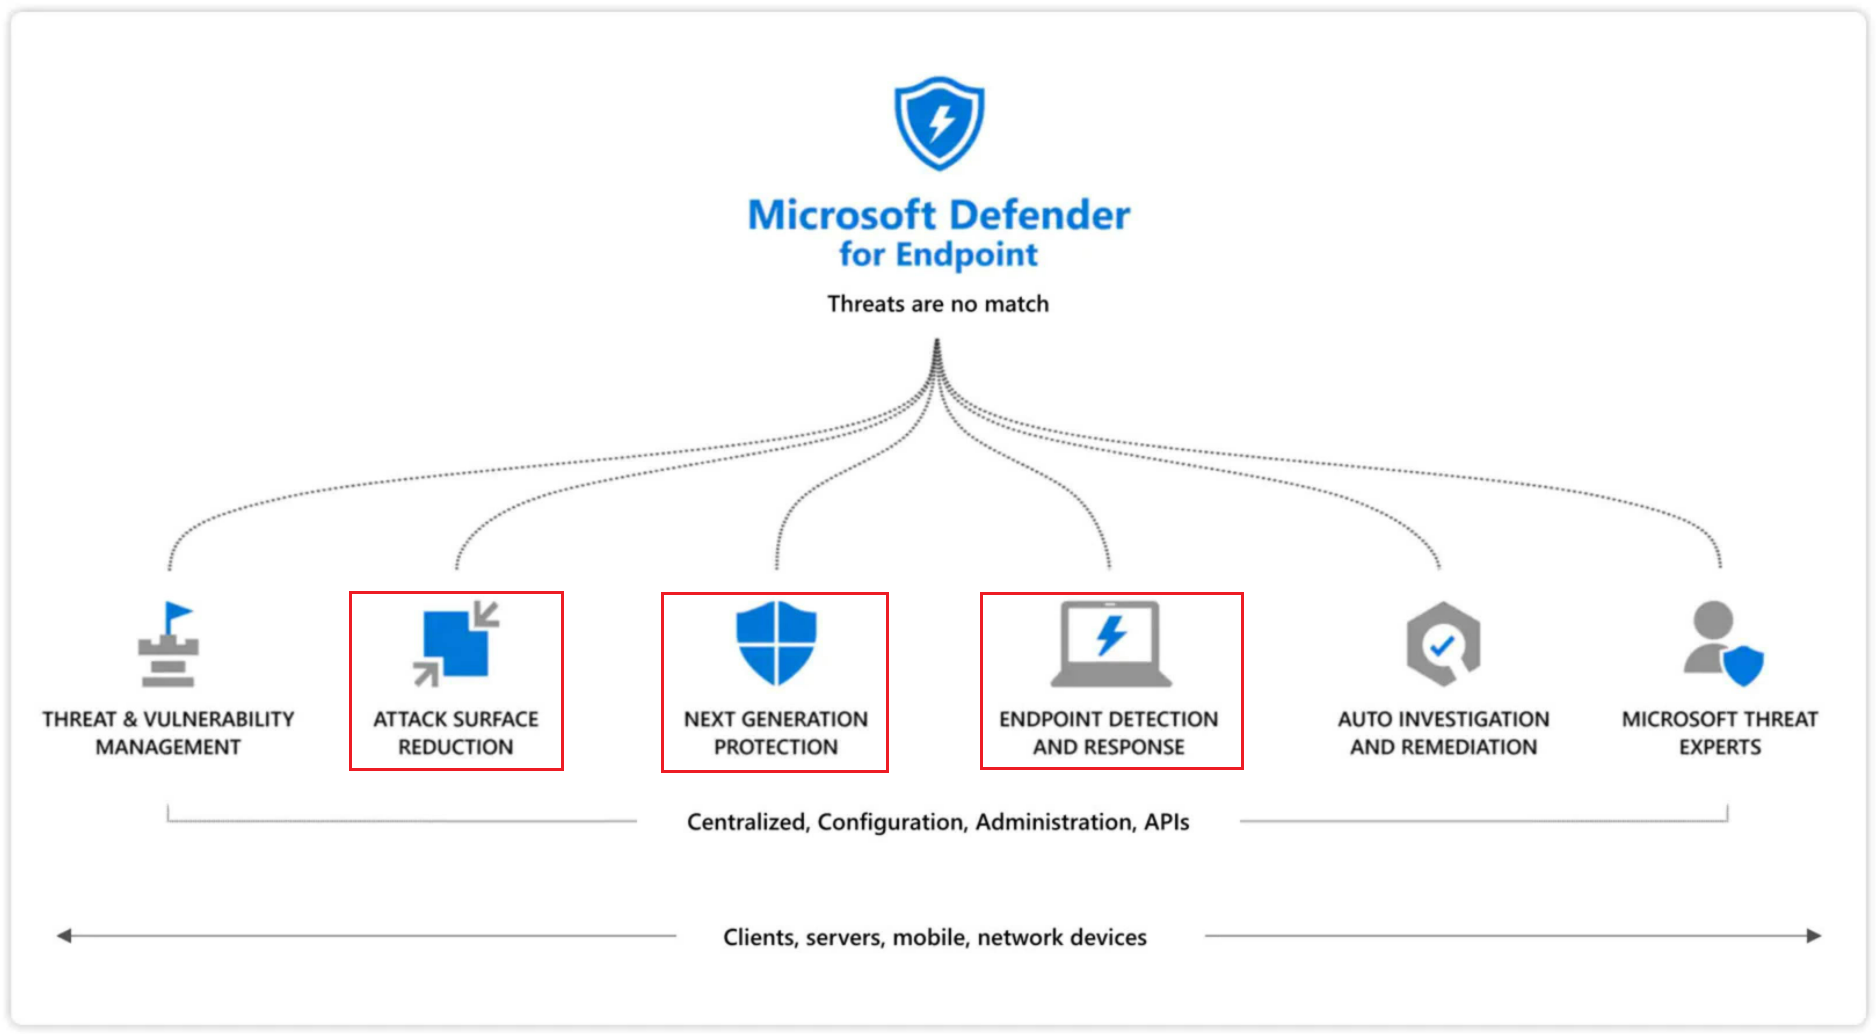
Most documentation on Microsoft Defender for Endpoint (MDE) is written for security architects. This guide is written for the IT support engineer who owns the daily operations: the person handling the "my laptop is slow" ticket, the developer exclusion request, the post-repair re-onboarding, and the L3 escalation package.
After running MDE operations across a managed enterprise fleet — Windows and macOS — here is what the field actually looks like.
Why Enterprise MDE Is Not the Same as Consumer Defender
On a personal Windows machine, Microsoft Defender is something you can adjust yourself. In an enterprise deployment managed via MDM (Microsoft Intune), it is a different product.
Key differences:
- Tamper Protection is enabled centrally. Users and local admins cannot change settings, add exclusions, or disable protection. All changes flow through MDM policy only.
- Policy is pushed from the cloud. The MDM platform deploys MDE configuration to every enrolled device — Windows and macOS — silently, consistently, and at scale. There is no per-device configuration.
- Performance is pre-tuned. Enterprise deployments apply CPU throttling, scan scheduling, and network share exclusions by default. These are not visible to users.
- Visibility lives in the portal. The security team monitors device health, alert status, and compliance from the MDE portal — not from the local machine.
For IT support, this means: you cannot fix most MDE issues locally. Your job is to diagnose correctly, apply what you can (raise the right ticket, re-run onboarding where needed), and escalate with the right artefacts.
The Performance Tuning That Is Already Applied
Before troubleshooting a performance complaint, it helps to know what tuning is already in place in a well-configured enterprise deployment.
| Setting | Typical Enterprise Configuration |
|---|---|
| Scan type | Quick Scan (not Full Scan) |
| CPU throttle | ScanAvgCPULoadFactor = 20–30% |
| Scan after definition update | Disabled |
| Network drives (SMB/UNC) | Excluded from real-time scanning |
| Developer build directory (Windows) | Excluded by default policy |
| Developer build directory (macOS) | Excluded by default policy |
If a user reports high CPU from MDE and their device is enrolled and compliant, the most likely causes are:
- A large write operation in a directory that is not excluded
- An IDE or build process that compiles many files rapidly
- A definition update sync that briefly spikes scan activity
- The device is not in the correct policy group (developer exclusions not applied)
The Developer Exclusion Workflow
Developer workloads — compiling code, running containers, using hypervisors — generate enormous file I/O. Without additional exclusions, MDE scans every file in every build cycle. This is the most common performance complaint in engineering teams.
The problem: Tamper Protection prevents anyone from adding exclusions locally. The only path is an IT support ticket.
What a complete exclusion request looks like
A well-formed ticket includes:
- Device hostname and operating system
- User's team or role (e.g. cloud platform engineer, backend developer)
- Specific processes or directories causing the impact (not just "it's slow")
- Whether Docker, Hyper-V, or other virtualisation is involved
The IT support engineer routes this to the team managing MDM policy. They assign the device to a developer policy group with the appropriate exclusions. Policy propagation typically takes up to 24 hours after group assignment.
Common exclusions for developer devices:
- IDE executable processes (Eclipse, VS Code, IntelliJ, etc.)
- Build output directories
- Container runtime processes (Docker Desktop daemon, etc.)
- Virtualisation processes (Hyper-V, VMware, Parallels)
- Development SDK tool directories
Diagnosing High CPU on macOS
When a macOS user reports high CPU from the MDE process (wdavdaemon), these are the steps to work through.
Step 1: Confirm it is actually MDE
Open Activity Monitor, sort by CPU, and confirm wdavdaemon is the culprit. Note the sustained CPU percentage and whether it correlates with a specific user activity.
Step 2: Check sensor health
mdatp health
This returns the current state of real-time protection, cloud connectivity, and the sensor. Confirm real_time_protection_enabled: true and healthy: true. If the sensor is unhealthy, that is a separate problem from performance — it means MDE is not reporting to the portal, which requires re-onboarding (covered below).
Step 3: Check what exclusions are active
mdatp exclusion list
Review the output. If the expected developer directories are absent and the user is a developer, that is your answer — raise the exclusion ticket.
Step 4: Identify what is being scanned
For persistent high CPU with no obvious cause, you can monitor in real time what files wdavdaemon is opening:
sudo eslogger exec open | jq -r 'select(.process.executable.path | contains("wdavdaemon")) | "\(.time) \(.event.open.file.path)"'
This shows exactly which file paths MDE is scanning. If a directory generating large I/O volumes appears in this output and is not already excluded, that is the root cause to bring to the exclusion ticket.
Diagnosing High CPU on Windows
The Windows equivalent is the MpPerformanceRecording tool, built into Defender.
Step 1: Capture a recording
Run PowerShell as Administrator:
New-MpPerformanceRecording -RecordTo C:\recording.etl
Reproduce the performance issue (open the IDE, run a build, do whatever triggers the slowdown). Then stop the recording with Ctrl+C.
Step 2: Analyse the top scanned files
Get-MpPerformanceReport -Path C:\recording.etl -TopFiles 3 -TopScansPerFile 10
The output shows which files are being scanned most frequently and how long each scan takes. If a build output directory or IDE temp path appears at the top, you have your exclusion target.
Device Re-Onboarding After Hardware Repair
This is one of the most consistently missed steps in IT support — and it matters from a security standpoint.
When a device has a major hardware component replaced (motherboard on Windows, logic board on macOS), the device hardware identity changes. In some cases, MDE's onboarding state becomes invalid. The device may stop appearing as active in the MDE portal even though the OS and Intune enrolment are intact.
How to detect it: Check the device in the MDE portal. If it shows as inactive, not reporting, or missing after a hardware repair, re-onboarding is required.
How to fix it: Re-apply the MDM onboarding profile. On an Intune-managed device, this is typically done by triggering a device sync or re-running the onboarding script. The MDM platform re-pushes the MDE onboarding configuration, and the device re-registers with the portal within minutes.
A good walkup or IT desk checklist should include: "After any motherboard or logic board replacement — verify device appears active in endpoint security portal."
Escalating to L3
If L1/L2 troubleshooting does not resolve an MDE issue, escalate with a complete artefact package. An escalation without artefacts will be returned.
Required artefacts for an L3 MDE escalation:
- MDE Analyzer logs — run the built-in MDE Analyzer tool (available via the MDE portal or locally). It generates a ZIP of diagnostic logs, configuration state, and recent event history.
- Procmon log — a Process Monitor capture from the period of the reported issue. This shows what processes are interacting with what files and whether any third-party software is conflicting with MDE.
- MpPerformanceRecording .etl file (Windows only) — captured during the performance issue as described above.
Include in the ticket:
- Device hostname and OS version
- MDE version (from
mdatp healthon macOS, or Get-MpComputerStatus on Windows) - Description of when the issue started and what changed (recent update, hardware change, policy change)
- The escalation category for your ITSM routing
The L3 team will review cloud-side sensor data alongside the local artefacts. Most escalations at this level involve either a cloud policy conflict, an exclusion that requires backend configuration, or a firmware-level interaction that local tooling cannot resolve.
The Support Scenarios You Will See Most Often
| Scenario | What To Do |
|---|---|
| High CPU on macOS — wdavdaemon | Run mdatp health + exclusion list. Check if developer paths are missing. Raise exclusion ticket if needed. Use eslogger to identify specific scan targets. |
| IDE starts very slowly on Windows/macOS | Classic indicator of missing IDE process exclusion. Verify current exclusions, raise exclusion ticket for IDE executable. |
| User wants to add their own exclusion | Not possible — Tamper Protection is on. Explain the ticket process. Gather device hostname, role, and specific paths. |
| MDE not showing as active in portal | Run mdatp health (macOS) or Get-MpComputerStatus (Windows). If post-hardware-repair, trigger MDM re-onboarding. |
| Post-motherboard/logic-board replacement | Check MDE portal after repair. If inactive — re-sync MDM profile to re-onboard. |
| Issue persists after all L1/L2 steps | Collect MDE Analyzer + Procmon + .etl, raise L3 escalation with full artefact package. |
The Key Mindset Shift for MDE Support
Enterprise endpoint security is not something IT support configures — it is something IT support operates within. The security team sets the policy. IT support's role is to:
- Diagnose correctly using the available tooling
- Gather the right information before raising tickets or escalations
- Know the escalation path and what artefacts each level needs
- Keep device onboarding state clean — especially after hardware changes
MDE is highly capable and, once tuned correctly, runs invisibly. The cases that reach the IT desk are almost always about missing exclusions or broken onboarding state — both solvable with the right workflow.
This guide covers enterprise MDE operations from an IT support perspective. For security architecture, threat investigation, or advanced hunting queries, refer to your organisation's security operations team.
Learn more in the MS Defender for Endpoint course on the IT Learning platform.