The Dashboard Graveyard Problem
Every IT organisation has a dashboard graveyard. Reports that took weeks to build, that someone looked at three times, and that now sit forgotten in a SharePoint folder.
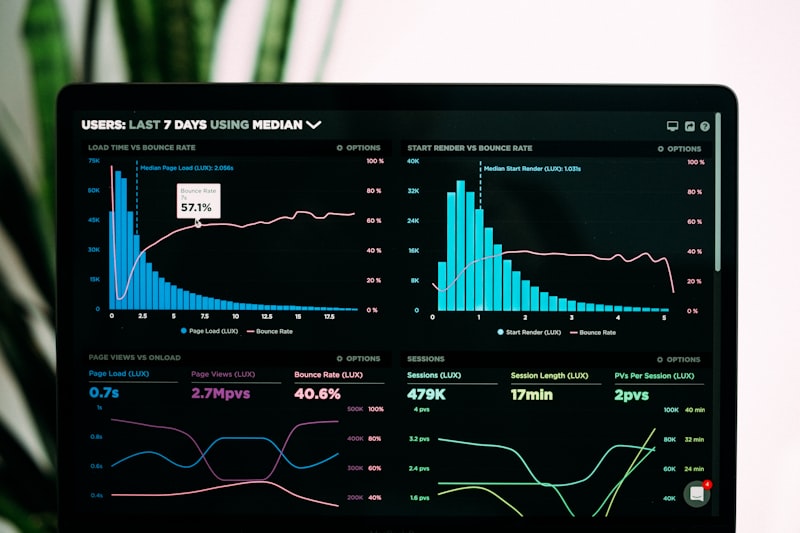
I built my first IT dashboard in 2018. By 2020, it was in the graveyard. I rebuilt it in 2022 with a different approach — this time anchored in the questions IT leadership actually asked, not the metrics I thought they should care about.
The second dashboard gets reviewed every Monday.
Start With the Question, Not the Data
The most common dashboard mistake: building from available data outward. You have SNOW data, you have asset data, you have AD data — so you build charts from all of it.
The right approach: Start by asking every person who will use the dashboard: "What questions do you need answered each week to do your job?"
At a large enterprise, the answers were:
- Senior Leadership: "Are we meeting our SLAs? Any big issues this week?"
- IT Manager: "Where are tickets backing up? Which engineer is overloaded?"
- Finance (quarterly): "What are we spending on IT? What's the asset refresh bill?"
- IT Team: "What's open and due today?"
Four users, four different dashboards — or four pages in one dashboard with the right navigation.
The IT Operations Dashboard Architecture
◆ IT Dashboard Page Structure
Page 1: Executive Summary — SLA %, open tickets, critical issues
Audience: Senior Leadership. Updated: daily. KPIs only, no details.
Page 2: Ticket Operations — volume, by category, by engineer, aging
Audience: IT Manager. Updated: daily. Drill-down to individual tickets.
Page 3: Asset Health — stock levels, warranty expiry, refresh planning
Audience: IT Admin. Updated: weekly. Colour-coded by status.
Page 4: Procurement Spend — monthly, vendor breakdown, YTD
Audience: Finance (quarterly review). Updated: monthly.
Page 5: Onboarding KPIs — new hires, IT readiness on Day 1, offboarding
Audience: HR + IT Manager. Updated: per event.
Connecting PowerBI to Real IT Data Sources
ServiceNow → PowerBI
ServiceNow has a REST API that PowerBI can connect to directly:
Source: REST API
URL: https://yourinstance.service-now.com/api/now/table/incident
Authentication: Basic (service account)
Parameters: ?sysparm_query=assigned_to=<your_group>&sysparm_fields=number,state,priority,opened_at,resolved_at
Set refresh to every hour for operational dashboards. Daily for trend reports.
SharePoint Lists → PowerBI
For IT asset data maintained in SharePoint:
- Get Data → SharePoint Online List
- Authenticate with M365 credentials
- Transform: filter out system columns, parse dates, create calculated columns
SharePoint lists are ideal for small-to-medium asset registers (< 50,000 rows) — the query performance is excellent.
Enterprise ERP Systems → PowerBI
For SAP or other ERP environments, expose metrics via:
- OData endpoint if available (preferred)
- SharePoint export if OData isn't configured
- CSV export as last resort (loses real-time capability)
The 5 Charts Every IT Operations Dashboard Needs
1. SLA Compliance Rate (Line Chart, Rolling 30 Days)
Shows trend, not just current state. Everyone can see if it's improving or degrading.
2. Ticket Volume by Category (Stacked Bar, Monthly)
Reveals patterns — seasonal spikes, category growth, the impact of KB articles on volume.
3. Mean Time to Resolution by Priority (Card + Gauge)
The first question from leadership: "How fast do we fix things?" This answers it clearly.
4. Asset Warranty Expiry Timeline (Timeline/Calendar)
Shows the next 12 months of warranty expirations. Prevents budget surprises. Colour-code: green (>12 months), amber (6–12 months), red (<6 months).
5. Open Tickets Aging (Heat Map or Matrix)
Which tickets are oldest? By engineer? By category? This one prevents SLA breaches by making aged tickets visible before they breach.
Dashboard Design Scorecard
Design Principles That Make Dashboards Readable
| Principle | Wrong | Right |
|---|---|---|
| Colour | Every chart has 8 colours | 3 consistent colours (green/amber/red) |
| Numbers | Showing 6 decimal places | Rounded, prefixed: 94%, 4.2 hrs |
| Charts | 12 charts on one page | 4–5 charts maximum per page |
| Labels | Showing all data labels | Only outliers and totals labelled |
| Titles | "Chart 1" | "SLA Compliance Rate — Last 30 Days" |
The rule I live by: If the chart needs a legend to understand it, simplify the chart.
Getting Buy-In: How to Make People Actually Use Your Dashboard
The best dashboard in the world fails if people don't open it. Adoption tactics that worked for me:
- Include it in Monday's IT meeting — pull it up on screen, walk through it. Creates the habit.
- Email the executive summary page every Monday morning — one screenshot, three bullet points, no login required.
- Ask for feedback in week 2 — "Is there anything you're not finding on here?" People will tell you exactly what they need.
- Name it after the audience — "IT Operations Dashboard" is for IT. "IT Service Report — Leadership View" is for senior stakeholders. Different names signal different purposes.
The goal is to become the source of truth for IT metrics. Once your dashboard is the thing people reference in meetings, it will always be maintained because there's a clear cost to letting it go stale.
◆ Pro Tips
- ▸ Interview each dashboard audience before building anything — ask "what question do you need answered every week?" and build exactly that, nothing more.
- ▸ Connect ServiceNow to PowerBI via the REST API rather than CSV exports — real-time refresh means your dashboard is always current without manual effort.
- ▸ Email the executive summary page as a screenshot every Monday morning — one image, three bullet points, no portal login required creates the habit faster than any training.
- ▸ Limit each page to 4–5 charts maximum — dashboards fail not because they lack data, but because they show too much and decision-makers can't find the signal.
- ▸ Build the asset warranty expiry timeline first — it tends to be the chart that immediately earns IT leadership's attention and buy-in for the entire dashboard project.