

Nexthink Amplify: How Real-Time Endpoint Data Transforms IT Support
Every IT support team faces the same bottleneck. A ticket arrives: "my laptop is slow." The L1 agent calls the user, asks them to open Task Manager, waits while they describe what they see, tries to interpret a verbal description of a performance graph, and eventually either resolves it or escalates — with minimal data attached.
That workflow is slow, inconsistent, and dependent on users accurately describing technical symptoms.
Nexthink Amplify breaks that pattern. The moment a ticket opens, the device data is already there.
What Nexthink Amplify Actually Is
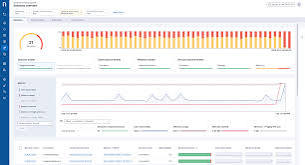
Nexthink Amplify is a browser extension that integrates directly into your ITSM ticketing platform. It reads the user or device associated with the ticket, pulls real-time endpoint telemetry from the Nexthink platform, and surfaces it inside the ticket — no separate tool, no portal switching.
The architecture is straightforward:
Managed Devices
      ↓
Nexthink Collector (lightweight agent on device)
      ↓
Nexthink Infinity Platform (cloud analytics engine)
      ↓
Amplify Browser Extension (inside your ITSM tool)
      ↓
IT Support Agent
The collector runs silently on managed endpoints and continuously streams telemetry to the platform. Amplify queries that telemetry in real time when you open a ticket.
What You Can See the Moment a Ticket Opens
| Data Point | Why It Matters |
|---|---|
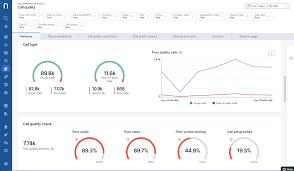
| CPU & memory usage | Is the device genuinely overloaded, or is the user perceiving slowness? |
| Boot & login time | Is startup slow? Has it degraded recently? |
| App crashes (7-day count) | Which application is unstable — and how often? |
| Network latency & Wi-Fi signal | Is this a connectivity issue or a device issue? |
| Disk space | Is storage causing the performance complaint? |
| Patch & compliance status | Is the device running an outdated OS or missing security patches? |
| BitLocker & encryption status | Security compliance check without calling the user |
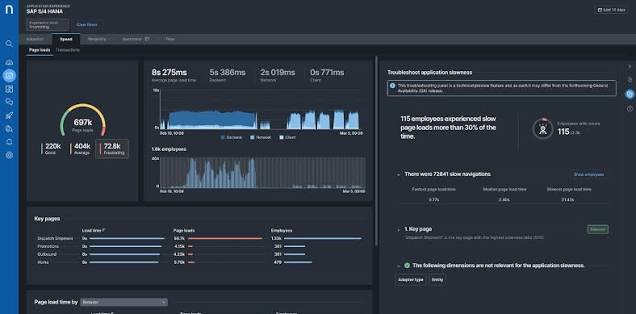
| Top CPU-consuming processes | Exactly which process is using the most resource right now |
This is not historical data exported from a report. It is live. When you look at it, you are seeing the device as it is in that moment.
One-Click Remote Actions
Beyond visibility, Amplify enables actions directly from the ticket — without opening a remote desktop session:
- Clear application cache — resolves a large proportion of Teams, browser, and productivity app complaints
- Restart background services — fixes stuck processes without asking the user to reboot
- Collect diagnostic logs — gathers logs remotely and attaches them to the ticket automatically
- Check Wi-Fi signal strength — confirms whether poor connectivity is the root cause
- Trigger compliance remediation — push a policy or configuration baseline via MDM integration
Every action is automatically logged against the ticket — full audit trail, no manual notes required.
The Impact on First Contact Resolution
First Contact Resolution (FCR) is the single most important metric in IT support operations. Every escalation to L2 or L3 costs time, increases MTTR, and reduces the user experience quality.
Nexthink Amplify improves FCR through two mechanisms:
1. Data removes guesswork. L1 agents no longer have to ask the user to describe their problem. The device data answers most diagnostic questions before the conversation starts.
2. Guided diagnostics remove inconsistency. Amplify surfaces recommended diagnostic steps based on what the telemetry shows. Agents follow the same path every time — nothing is skipped, nothing is missed based on experience level.
The result: issues that previously required L2 involvement (slow device, Teams instability, VPN performance, compliance gaps) get resolved at L1.
Common Support Scenarios Where Amplify Delivers
"My laptop is slow" Open ticket → Amplify shows CPU at 95%, top consumer is the antivirus real-time scanning process → check whether the device is missing its performance tuning policy → raise the appropriate remediation ticket with data already attached.
"My Teams calls keep dropping" Amplify shows Wi-Fi signal strength at the user's location is marginal → recommend wired connection or report the AP coverage gap to the network team. Resolved without remote session or user troubleshooting.
"My device was re-imaged and something doesn't seem right" Amplify shows compliance state, MDM enrolment status, and patch level instantly → confirms whether onboarding completed correctly or whether a profile needs to be re-pushed.
"This app keeps crashing" Amplify shows crash count for that application over the last 7 days → escalate to L2 or the application team with pre-captured frequency data rather than asking the user "how often does it happen?"
Proactive Detection: Finding Problems Before Users Report Them
Reactive support — waiting for tickets — is inherently inefficient. Nexthink's platform continuously analyses telemetry patterns across the device estate and can surface anomalies before they become user complaints:
- Crash rate spike across a cohort of devices following a software update
- Login time degradation trending upward across a specific hardware model
- Compliance drift following a policy change
- Network instability patterns tied to a specific location or AP
For IT operations teams, this shifts the model from firefighting to prevention. Catching ten devices degrading at once and remediating before the tickets arrive is always better than handling ten separate reactive incidents.
Amplify vs Traditional IT Support
| Without Amplify | With Amplify | |
|---|---|---|
| Time to diagnose | 15–30 minutes | 2–3 minutes |
| User involvement required | Yes — describe symptoms, share screen | Often not needed |
| L2/L3 escalation rate | Frequent for performance issues | Significantly reduced |
| Data quality for escalations | Manual, incomplete | Auto-captured, timestamped |
| Audit trail | Manual ticket notes | Automatic |
| Proactive issue detection | Not possible | Built in |
The Skill This Builds
Working with a tool like Nexthink Amplify develops a specific and increasingly valued skill: data-driven IT support. The ability to read endpoint telemetry, interpret what it means, act on it quickly, and communicate findings clearly — both to users and to escalation teams — is what separates modern IT engineers from traditional help desk operators.
The technology changes. The skill of using real-time data to diagnose and resolve faster does not.
Interested in endpoint visibility and proactive IT operations? Explore the Nexthink Amplify course on the IT Learning platform. date: "2026-07-30" excerpt: "When a user raises a ticket saying their laptop is slow, most IT support workflows start with questions. Nexthink Amplify starts with answers — device CPU, crash history, network quality, compliance state, all visible the moment you open the ticket. Here's how it changes the way IT support works." tags: ["IT Operations", "Endpoint Management", "ITSM", "IT Support", "Proactive IT", "Digital Workplace", "FCR", "MTTR"] author: "Waqas Syed" readTime: "9 min read" featured: false
Nexthink Amplify: How Real-Time Endpoint Data Transforms IT Support
Every IT support team faces the same bottleneck. A ticket arrives: "my laptop is slow." The L1 agent calls the user, asks them to open Task Manager, waits while they describe what they see, tries to interpret a verbal description of a performance graph, and eventually either resolves it or escalates — with minimal data attached.
That workflow is slow, inconsistent, and dependent on users accurately describing technical symptoms.
Nexthink Amplify breaks that pattern. The moment a ticket opens, the device data is already there.
What Nexthink Amplify Actually Is
Nexthink Amplify is a browser extension that integrates directly into your ITSM ticketing platform. It reads the user or device associated with the ticket, pulls real-time endpoint telemetry from the Nexthink platform, and surfaces it inside the ticket — no separate tool, no portal switching.
The architecture is straightforward:
Managed Devices
      ↓
Nexthink Collector (lightweight agent on device)
      ↓
Nexthink Infinity Platform (cloud analytics engine)
      ↓
Amplify Browser Extension (inside your ITSM tool)
      ↓
IT Support Agent
The collector runs silently on managed endpoints and continuously streams telemetry to the platform. Amplify queries that telemetry in real time when you open a ticket.
What You Can See the Moment a Ticket Opens
| Data Point | Why It Matters |
|---|---|
| CPU & memory usage | Is the device genuinely overloaded, or is the user perceiving slowness? |
| Boot & login time | Is startup slow? Has it degraded recently? |
| App crashes (7-day count) | Which application is unstable — and how often? |
| Network latency & Wi-Fi signal | Is this a connectivity issue or a device issue? |
| Disk space | Is storage causing the performance complaint? |
| Patch & compliance status | Is the device running an outdated OS or missing security patches? |
| BitLocker & encryption status | Security compliance check without calling the user |
| Top CPU-consuming processes | Exactly which process is using the most resource right now |
This is not historical data exported from a report. It is live. When you look at it, you are seeing the device as it is in that moment.
One-Click Remote Actions
Beyond visibility, Amplify enables actions directly from the ticket — without opening a remote desktop session:
- Clear application cache — resolves a large proportion of Teams, browser, and productivity app complaints
- Restart background services — fixes stuck processes without asking the user to reboot
- Collect diagnostic logs — gathers logs remotely and attaches them to the ticket automatically
- Check Wi-Fi signal strength — confirms whether poor connectivity is the root cause
- Trigger compliance remediation — push a policy or configuration baseline via MDM integration
Every action is automatically logged against the ticket — full audit trail, no manual notes required.
The Impact on First Contact Resolution
First Contact Resolution (FCR) is the single most important metric in IT support operations. Every escalation to L2 or L3 costs time, increases MTTR, and reduces the user experience quality.
Nexthink Amplify improves FCR through two mechanisms:
1. Data removes guesswork. L1 agents no longer have to ask the user to describe their problem. The device data answers most diagnostic questions before the conversation starts.
2. Guided diagnostics remove inconsistency. Amplify surfaces recommended diagnostic steps based on what the telemetry shows. Agents follow the same path every time — nothing is skipped, nothing is missed based on experience level.
The result: issues that previously required L2 involvement (slow device, Teams instability, VPN performance, compliance gaps) get resolved at L1.
Common Support Scenarios Where Amplify Delivers
"My laptop is slow" Open ticket → Amplify shows CPU at 95%, top consumer is the antivirus real-time scanning process → check whether the device is missing its performance tuning policy → raise the appropriate remediation ticket with data already attached.
"My Teams calls keep dropping" Amplify shows Wi-Fi signal strength at the user's location is marginal → recommend wired connection or report the AP coverage gap to the network team. Resolved without remote session or user troubleshooting.
"My device was re-imaged and something doesn't seem right" Amplify shows compliance state, MDM enrolment status, and patch level instantly → confirms whether onboarding completed correctly or whether a profile needs to be re-pushed.
"This app keeps crashing" Amplify shows crash count for that application over the last 7 days → escalate to L2 or the application team with pre-captured frequency data rather than asking the user "how often does it happen?"
Proactive Detection: Finding Problems Before Users Report Them
Reactive support — waiting for tickets — is inherently inefficient. Nexthink's platform continuously analyses telemetry patterns across the device estate and can surface anomalies before they become user complaints:
- Crash rate spike across a cohort of devices following a software update
- Login time degradation trending upward across a specific hardware model
- Compliance drift following a policy change
- Network instability patterns tied to a specific location or AP
For IT operations teams, this shifts the model from firefighting to prevention. Catching ten devices degrading at once and remediating before the tickets arrive is always better than handling ten separate reactive incidents.
Amplify vs Traditional IT Support
| Without Amplify | With Amplify | |
|---|---|---|
| Time to diagnose | 15–30 minutes | 2–3 minutes |
| User involvement required | Yes — describe symptoms, share screen | Often not needed |
| L2/L3 escalation rate | Frequent for performance issues | Significantly reduced |
| Data quality for escalations | Manual, incomplete | Auto-captured, timestamped |
| Audit trail | Manual ticket notes | Automatic |
| Proactive issue detection | Not possible | Built in |
The Skill This Builds
Working with a tool like Nexthink Amplify develops a specific and increasingly valued skill: data-driven IT support. The ability to read endpoint telemetry, interpret what it means, act on it quickly, and communicate findings clearly — both to users and to escalation teams — is what separates modern IT engineers from traditional help desk operators.
The technology changes. The skill of using real-time data to diagnose and resolve faster does not.
Interested in endpoint visibility and proactive IT operations? Explore the Nexthink Amplify course on the IT Learning platform.